I noticed that you guys use distance_transform_edt from scipy. Does this apply to 3D structures? Also, what does min_distance represent?
I’m asking because I’m interested in counting the number of nuclei after segmentation. My nuclei are slightly irregularly shaped and most of them look elliptical. I decided to go with the Nucleophosmin segmentation notebook. However, after segmentation, I’m interested in counting the number of nuclei present. I was hoping to do this using a distance transform followed by a counting of the maximum. However, this is not working for me. Do you have any suggestions?
distance_transform_edt works for 3D.
When you say parameter “min_distance”, which function you are referring?
To answer your last question, do you mind posting a sample input image and your current result?
My mistake. For min_distance, I was referring to the local_peaks_max function, which you use in conjunction with the distance transform when you do the watershed on the desmoplakin.
Here’s a snip from my jupyter notebook:
the min_distance is the minimal distance between two peaks allow.
Currently, we don’t have a classic workflow for nuclei segmentation. I agree that the closest one is Nucleophosmin. But, actually, you may not need all the steps in the NPM1 workflow. Here is what I would suggest:
(1) try a couple of thresholding method: Otsu, median, … or the adaptive thresholding method we used in the first step of NPM1. https://github.com/AllenInstitute/aics-segmentation/blob/master/docs/API.md#MO
(2) The thresholding step will give you segmentation of overall shapes, hopefully, but proximal cells could be falsely merged. Then, you may apply distance transformation on the binary mask.
(3) Apply peak detection on the distnace map. Hopefully, each nucleus gets one local peak. If you only need to count the cells, then you are done.
(4) If you need the shape of nuclei, run the seeded watershed on the inverse distance map with the local peak as seeds.
Hopefully, it helps. Let us know if you need more help.
Jianxu
1 Like
Thanks so much for all your help! I will try Otsu, median and the adaptive thresholding methods suggested above. I had a question about implementing a different type of thresholding algorithm.
The cell nuclei that I’m working with are muscle fibers. The paper here works with the same fibers/nuclei except that they work in 2D. For binarization, they use a moving circular window and subtract the intensity of each pixel from the mean of the window. They then compare the resulting pixel value to a threshold to obtain the binarized image.
How do you think I could efficiently implement this in 3D in python (instead of simple for loops)? I have seen the 2D implementation in skimage.filters.threshold_local but I’m unsure how I would implement this in 3D (slice by slice perhaps?). Should I translate a spherical window or a cylindrical window?
Sorry for asking so many questions!
You are very welcome. We are here to help. That is the whole point of this forum.
Regarding your question, you can check out this:
https://docs.scipy.org/doc/scipy-0.14.0/reference/generated/scipy.ndimage.filters.convolve.html
If you create a ball shape kernel, then you can convolve it over your image. Then, a global cutoff can be applied to the convolution output to get the binary image.
Thanks for that!
One last question about your code. In the code for the MO_threshold, you specify a connectivity of 1. Shouldn’t you specify higher connectivity since you’re working in 3D?
you can choose a different connectivity. it totally depends on your application. we chose connectivity = 1 for a reason. MO is essentially a two stage thresholding. The first stage is to separate the colony into individual cells. Then, a local threshold is calculated within each cell. It is okay if two cells are close to each other and picked up as a merged object in stage one, but we hope to separate as much as we can. For the same spirit, connectivity = 1 gives us higher chance to disconnect proximal cells in stage one.
hope this is helpful
Jianxu
I see.
Wouldn’t it be better to choose a higher connectivity?
Because if something doesn’t share connectivity of 6, it’ll be removed by the “remove_small_objects” function and so you’d get a “stricter” segmentation result? Am I thinking about this correctly?
Your consideration is totaly correct. Again, it depends on your image/application. In our npm1 case, using small value for min_obj_size and connectivity = 1 is unlikely to remove true target structures. So, in a different problem, you think about (1) do you have to set min_obj_size relatively large? it is possible for image with lots of background noise. (2) if you have to use large value for min_obj_size and your target strucutre could have pieces of size smaller than min_obj_size, then you can try connetivity =3. (3) when trying that, you may compare it with connectivity =1 and observe the difference qualitatively and quantitatively.
i am so glad you are looking at such seemingly “minor” details. These details could be very important if you want your downstream quantification more reliable. That is why we want to expose all the source code to the user whiling providing a hopefully user-friendly interface. In a GUI-only software, it could be hard to even notice or think about such details.
Thanks a lot for the clarification.
And yes, you’re totally right about the GUI-only softwares like ImageJ/MITK. You don’t really get to play around with the functions “under the hood”. I really appreciate your guys’ open-source approach to the workflows!
Do you think the spot filter would be useful for my images?
I think it may not be very helpful
What exactly is the purpose of the spot filter? From my images it seems to be drawing around the circumference of the cells.
Bright Spot Filter:
Dark Spot Filter:
In our NPM1 case, there are some bright spots we need to detect and some dark holes need to be removed from the mask. They are just doing what their names tell. if you go to allencell.org/segmenter, you can find sample images of npm1.
i don’t think your data need either bright spot or dark spot. you only first half of the workflow, basically the MO function. That is why in my earlier post, I suggested a few different thresholding methods to try out. 
1 Like
You were totally right, I checked the Dice coefficients between the images before and after the spot filter and there was almost no difference. I’ve decided to ignore the spot filter for now.
I am now working on finding local peaks in my images. The peak_local_max function isn’t working as well as I’d hoped. I applied the distance_transform_edt to my segmented images and then applied the peak_local_max on the distance transformed output. However, I do not detect a lot of peaks in the segmentation and sometimes will assign many peaks to a single nuclei.
Below, I’ve attached examples illustrating my problem. It’s a 3x1 subplot of the original, distance transformed and segmented images. The segmented images should have the local peaks overlayed.
Here’s an example of too many peaks assigned to incorrectly segmented nuclei:
Here’s an example of too little/no peaks:
Here’s an example of too few peaks and too many local peaks found on correctly segmented nuclei:
Please let me know your thoughts. I can also send you images formatted differently if you’d like.
after looking at the images in details, I just realize that the nuclei in your data are sometimes so elliptical that distance transformation + peak detection may have a very hard time. In general, how well is your current segmentation? Can you post one example where you feel the segmentation is very good (except falsely merged objects) and one example where you feel the segmentation is very bad?
If the goal of post-processing is simply correctly cut the falsely merged objects, there are usually two different methods: (1) distance transformation + peak detection, but most suitbale for round shapes, (2) morphological eroson and its variants could be an alternative solution and seems to be more suitable for your case.
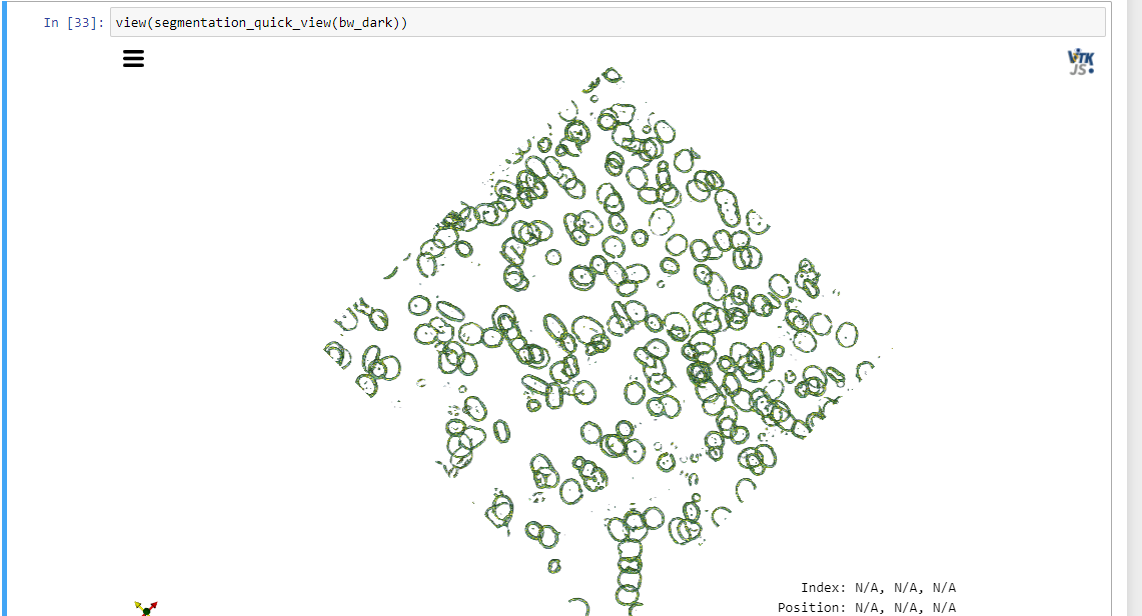
Would you like an example of a slice where the segmentation is very good and an example of a slice where the segmentation is bad?
Or would you like two different segmentations - one good and one bad?
Also, would you like the files or screenshots?
Results from one algorithm that you think is achieving the best overall performance should be enough. Then, in the result, it would be great to see examples where it still fails, and where it is ready good
So you’re interested in looking at the segmentations only right?